Speech Pressure-Flow Laboratory
The speech pressure-flow laboratory evaluates patients with craniofacial anomalies, mostly repaired cleft lip and/or palate. The lab originated as a result of the pioneering work of Donald W. Warren, DDS, PhD, in the 1960s. Dr. Warren, the first director of the UNC Craniofacial Center, applied hydrokinetic principles to the study of velopharyngeal (VP) function during speech. As described below, he showed that the area associated with VP insufficiency could be estimated during speech production. Today, the lab continues to serve as a clinical and research arm of the center. The primary function of the lab is the assessment of the nasal airway during respiration and VP closure during speech. In addition, the lab has the capacity to provide Nasometric, electroglottographic (EGG), and acoustic evaluations of patients. Several hundred individuals, mostly children and adolescents with various types of cleft palate and neuromotor disorders, are evaluated annually.
Why Use Aerodynamic Assessment?
Individuals with velopharyngeal (VP) dysfunction typically exhibit speech characteristics that include hypernasality, weak pressure consonants, audible nasal air emission, and unusual articulations. Characteristics such as hypernasality, weak pressure consonants, and audible nasal air emission are considered obligatory because these will occur to various degrees whenever there is incomplete separation of the oral and nasal cavities. By definition, weak pressure consonants and audible nasal air emission are aerodynamic in nature. Although hypernasality is primarily an acoustic/resonance phenomenon, it too can have detectable nasal airflow. The perceptual descriptions of these symptoms vary widely among clinicians, especially descriptions of nasal air emission. Aerodynamic assessment of the magnitude of oral and nasal air pressures and of nasal air loss, therefore, is essential if one wishes to objectively evaluate the extent of VP dysfunction during speech production. Some unusual articulations such as posterior nasal fricatives also have distinct aerodynamic characteristics.
Perhaps the most important role of speech aerodynamics relates to outcome assessment. Given that the goal of cleft palate surgery is to repair the palatal structures in order for a child to achieve normal speech production, surgeons should be especially interested in pressure-flow techniques. As described below, aerodynamic techniques can objectively document if the primary goal of palatal surgery (i.e., achieving normal VP closure) has been achieved.
Aerodynamic Principles and Techniques
The following is a brief tutorial on basic principles and techniques of aerodynamic assessment. A list of selected references follows the tutorial.
Pressure-Flow Technique
The pressure-flow technique was first applied to assess velopharyngeal (VP) function during speech by Warren and colleagues during the 1960s. Based on principles of fluid mechanics, the technique enables an estimate of the size of any existing VP gap during speech production. As illustrated below, the size of an orifice can be calculated if the differential pressure and volume rate of flow can be determined.
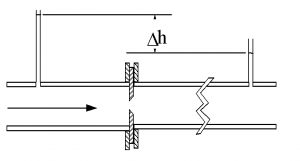
In the above illustration, water flows through a pipe and encounters a constriction. In order to flow through the constriction, there is an increase in volume velocity with a subsequent loss of driving pressure (illustrated by the change in height of the water column downstream from the constriction). The area of the constriction (or orifice) can be calculated in square millimeters by using a derivative of Bernoulli’s equation:
Area = (V/√ΔP) (.11)
where V is the volume rate of flow in mL/s and ΔP is the differential pressure in cm of water. The constant (.11) includes corrections for density of the fluid and a discharge coefficient that is determined by the shape of the orifice. When applied to speech, the “orifice equation” will estimate the size of an existing VP gap.
Application of the above principles to the human upper vocal tract is illustrated below.
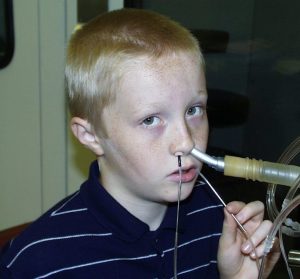
In this photograph, oral air pressure is tapped by a small plastic tube placed in the mouth behind the lips. The oral air pressure represents the upstream pressure before the constriction in the pipe illustration. A second plastic tube is embedded in a foam plug and inserted in one of the nostrils. This seals the nostril and taps nasal air pressure. The nasal air pressure represents the downstream pressure after the constriction in the pipe illustration. Finally, a flow tube is fitted into the remaining nostril to channel nasal airflow. The oral and nasal pressure tubes are attached to separate differential pressure transducers referenced to atmosphere. The nasal flow tube is connected in series to a heated pneumotachograph and differential pressure transducer. We use commercially-available hardware and software (PERCI-SARS, Microtronics, Chapel Hill, NC ) to acquire and display the aerodynamic speech data. In addition, a microphone records the acoustic speech signal.
Speech Samples
Because VP closure is typically complete during production of obstruent consonants by speakers without cleft palate, these segments are used to assess VP function. The voiceless bilabial stop /p/ is often used because a) it is produced with relatively high oral air pressure, and b) the pressure catheter can be easily placed behind the lips with minimal interference by the tongue during articulation. In our laboratory, we obtain pressure-flow data using the following speech samples. Click on each sample below to see a pressure-flow output from a non-cleft speaker (nasal air pressure is omitted from the output in the examples).
· The sentence Peep into the hamper
Each of the syllables and the word hamper are produced approximately 5 times as a continuous utterance (i.e., a single breath group). The sentence is produced 3 times also on a single breath group. We instruct all children to use their habitual loudness levels. Because some children with VP dysfunction may reduce loudness as a compensatory strategy to mask obligatory symptoms (i.e., “soft voice syndrome”), we will ask the child to repeat the samples with increased (normal) loudness. Similarly, if a child uses excessive loudness, we will ask the child to repeat the samples using a softer (normal) voice.
Zajac (2000) provides normative pressure-flow data for children and adults without cleft palate producing the above speech samples.
Interpretation of VP Area
Warren and colleagues have suggested the following categories of function based on VP area findings during production of /p/ in the word hamper:
-
- Adequate – 0 to 4.9 sq mm
- Borderline-Adequate – 5.0 to 9.9 sq mm
- Borderline-Inadequate – 10.0 to 19.9 sq mm
- Inadequate – 20 sq mm and larger
Warren and colleagues emphasized that these categories refer to the aerodynamic demands for speech. That is, although a VP opening of 3 or 4 sq mm may not be normal, the speaker can still produce the necessary oral air pressures for speech to be perceptually adequate (i.e., to be largely free of obligatory symptoms of hypernasality, weak pressure, and audible nasal air escape). Indeed, we have shown that oral air pressure levels of normal speakers are minimally reduced when producing /p/ under experimentally-induced bleed openings of 5 sq mm (Zajac and Weissler, 2004). Conversely, when VP areas reach 20 sq mm or greater, speech is consistently characterized by obligatory symptoms to various degrees.
Limitations of the Pressure-Flow Technique
As with any instrumental approach, the pressure-flow method has limitations. First, various studies have shown only moderate correlations between perceived hypernasality and estimates of VP gap size in speakers with cleft palate. This should not be surprising, however, as hypernasality is primarily an acoustic/resonance phenomenon that occurs on vowels and voiced consonants while pressure-flow estimates of VP area are typically done on the voiceless stop /p/. Because vowels are produced with a relatively open oral cavity, air pressure is greatly reduced and calculation of VP area is problematic. Second, detecting oral air pressure during production of alveolar (/t/) and especially velar (/k/) stops is difficult due to tongue interference with catheter placement. Detection of oral air pressure for velar stops requires a buccal sulcus or nasopharyngeal placement of the sensing catheter that is not practical for clinical assessment of young children, or even adults. Finally, accuracy of area estimates is dependent upon the value of the discharge coefficient used in the orifice equation to correct for turbulent flow. Warren and colleagues used a value of 0.65 based on model studies that used short tubes and thin orifice plates with sharp entrances. As indicated by Yates et al. (1990) and others, the entrance geometry of the VP port is likely tapered and rounded. Such a geometry will result in less turbulent flow and a higher value for the coefficient. This means that calculated VP areas using the “orifice equation” are likely larger (by up to 30%) than the actual area depending upon the exact shape of the VP port.
PaCE: A Modified Approach to Assessment and Interpretation
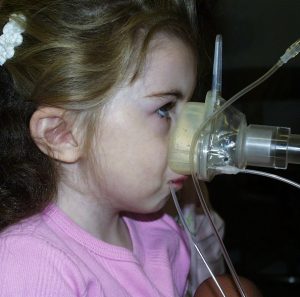
Given the above limitations, we have begun to modify our approach to both data collection and interpretation of findings. The change in data collection is illustrated in the photograph below. A small mask is used to obtain nasal airflow rather than a flow tube and mask pressure is used as a substitute for nasal pressure. This change has two advantages relative to the standard (flow tube) approach. First, young children often better tolerate the mask. Second, because mask pressure is used, the calculated area reflects an effective VP and nasal area. This occurs because the differential pressure used in the orifice equation now includes a pressure drop across the exit of the nose in addition to a pressure drop across the VP port. We believe that calculation of an effective VP-nasal area should better correspond to perceived hypernasality and audible nasal air emission given that both are obviously influenced by the nasal cavity. Another change involves the speech samples. We now obtain pressure-flow data during production of the syllables /bi/ and /ba/. The addition of these voiced speech samples should better correlate with perceived hypernasality. As described next, it also allows a speaker-centered approach to interpretation of area data.
Our speaker-centered approach involves the calculation of a palatal closure efficiency (PaCE) index. This is a ratio of the areas obtained from the syllables /mi/ and /bi/, a nasal-stop minimal pair, expressed as a percentage. Essentially, we determine the extent that a speaker can achieve closure relative to his/her own VP opening during production of the nasal consonant /m/. As reported by Zajac (2000), estimated VP areas for /m/ are age dependent, with younger children typically having smaller areas than adults. The PaCE index is calculated as: 100 – ((bi area ÷ mi area) x 100). To explain the index and highlight interpretation, consider the following clinical case. We recently evaluated a 3 year-old child with repaired unilateral cleft lip and palate. He exhibited moderate hypernasality and audible nasal air escape, at times with a nasal grimace. Using the mask approach, his estimated VP-nasal areas during production of /mi/ and /bi/ were 9.8 and 7.3 sq mm, respectively. The PaCE index was 26%, meaning that he was able to achieve closure of only 26% during /bi/ relative to /mi/. Of interest, his palatal function for /bi/ would be considered “borderline-adequate” based on traditional area criteria. Obviously, in this case, the PaCE index is more consistent with perceptual symptoms than traditional area categories. We are currently collecting additional clinical data to evaluate the utility of the PaCE index relative to perceptual symptoms.
Velopharyngeal Timing
Aerodynamic techniques are ideally suited to assess timing aspects of velopharyngeal (VP) function. As suggested by Warren and colleagues, temporal aspects of opening and closing gestures may be as important (or more so in some cases) than the actual size of the VP gap. Duration of the VP closing gesture can be determined from nasal airflow data obtained during production of speech samples containing nasal-plosive sequences as in the word hamper illustrated below.
The above output is from a non-cleft speaker who produced the word hamper. Nasal airflow is segmented as follows: 1) A to B reflects anticipatory nasal airflow prior to the /m/ segment (nasal airflow is higher during the voiceless consonant /h/ as compared to the vowel /æ/ due to decreased glottal resistance), 2) B to C reflects the beginning to peak nasal airflow associated with the /mp/ sequence, and 3) C to E reflects peak to the end of nasal airflow associated with the /mp/ sequence. Given the nasal-plosive context, the duration of the VP closing gesture can be inferred as the time from C to E (approximately 75 ms in this example). As noted by Dotevall et al. (2002), nasal airflow may not decline to zero if a speaker has VP dysfunction. Because of this, Dotevall et al. (2002) suggest that the end of nasal airflow be considered at 5% to baseline. In the above example, the horizontal dotted line indicates the 5% to baseline airflow criterion. It may be necessary to normalize the VP closing duration if comparisons are made across speakers who differ in speaking rate (e.g., adults and children). This can be done by using the duration of the nasal airflow segment from A to E. This segment reflects approximately the duration of the first syllable of the word hamper.
Dotevell et al. (2002) also suggested that the negative peak of the derivative of nasal airflow (Point D above) may be a useful index of VP function. The negative peak reflects the fastest rate of nasal airflow declination during VP closure. Dotevall et al. (2002) normalized this value by reference to peak nasal airflow (Point C above).
The diagnostic importance of VP timing measures was highlighted by Warren et al. (1993). They reported that speakers with repaired cleft palate and adequate VP closure who were judged to be hypernasal demonstrated nasal airflow durations (segment B to E above) that were approximately 50 ms longer than speakers with repaired cleft palate and adequate VP closure who were judged not to be hypernasal and controls.
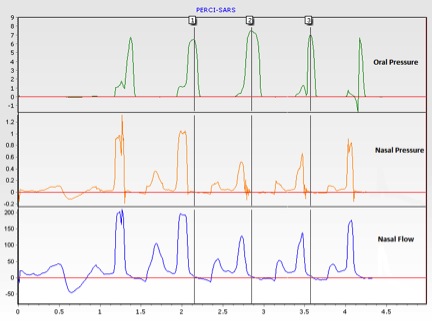
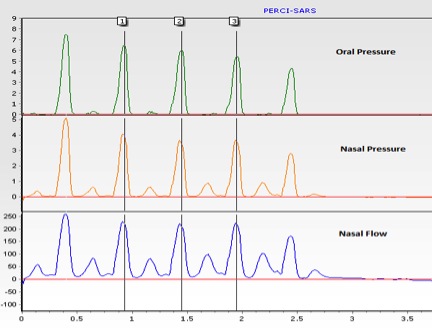
Finally, the extent of the overlap between the nasal airflow and oral air pressure pulses is a sensitive indicator of VP dysfunction. The examples below show five productions of the word hamper by speakers with adequate and inadequate VP function. Both examples were obtained using the standard (flow tube) approach. The three vertical cursors are positioned at peak oral air pressure associated with the middle three /p/ segments. Nasal air pressure and nasal airflow clearly precede the oral air pressure pulse in the first example, reflecting normal timing. In the second example, there is roughly complete temporal overlap between oral air pressure, nasal air pressure, and nasal airflow. In essence, the speaker was unable to aerodynamically separate the /m/ from the /p/ segments.
Simultaneous Oral and Nasal Airflow
In addition to the size of the velopharyngeal (VP) port, the magnitude of nasal airflow is determined by the configuration of the oral cavity. For a given VP opening, nasal airflow will vary as a function of oral cavity impedance. High vowels such as /i/ will shunt more airflow through the VP port than low vowels such as /ɑ/. As indicated previously, because oral air pressure is greatly reduced (approaching atmospheric), it is difficult to estimate VP area during vowels. Determination of simultaneous oral and nasal airflow, therefore, provides important aerodynamic information during speech production.
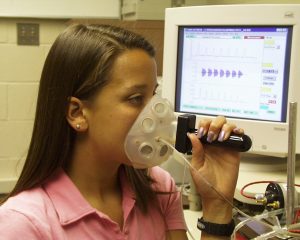
The photograph above illustrates the use of an oral-nasal circumferentially-vented pneumotachograph mask (Glottal Enterprises, Syracuse, NY ). The mask is partitioned into nasal and oral chambers. Each chamber has fine mesh, wire screens that serve as flow-resistive pneumotachographs. Catheters are inserted into each chamber to detect pressure variations associated with airflow. A microphone (not visible in the photograph) is positioned outside of the mask to record the audio signal.
As a comparison to the pressure-flow approach, the speech samples illustrated below were obtained using an oral-nasal mask. The same non-cleft speaker produced both sets of samples.
· The sentence Peep into the hamper
Laryngeal Aerodynamics
Many speakers with velopharyngeal (VP) inadequacy also present with perceptual symptoms of vocal dysfunction and/or laryngeal anomalies such as vocal fold nodules. Assessment of laryngeal airway resistance (LAR), therefore, can be a valuable clinical tool. LAR is calculated as the quotient of the transglottal pressure difference to laryngeal airflow during vowel production. Clinically, oral air pressure obtained during production of the voiceless stop /p/ is substituted for subglottal (tracheal) pressure (Smitheran and Hixon, 1981). This can be done because during bilabial closure for /p/, subglottal and oral air pressures equalize due to the open vocal folds, assuming that VP closure also occurs. To determine LAR, a plastic catheter is inserted through the chamber of a face mask and into the oral cavity. The catheter is connected to a differential pressure transducer referenced to atmosphere as in the pressure-flow method. The output of the mask is coupled in series to a heated pneumotachograph and differential pressure transducer, also as in the pressure-flow method. The speaker is instructed to repeat the syllable /pi/ seven times at a fairly slow rate to ensure stabilization of pressure. Alternatively, a divided oral-nasal pneumotachograph mask can be used as in the example below. This has the advantage of monitoring nasal airflow to confirm VP closure. If significant nasal airflow occurs, then the nostrils of the speaker must be occluded.
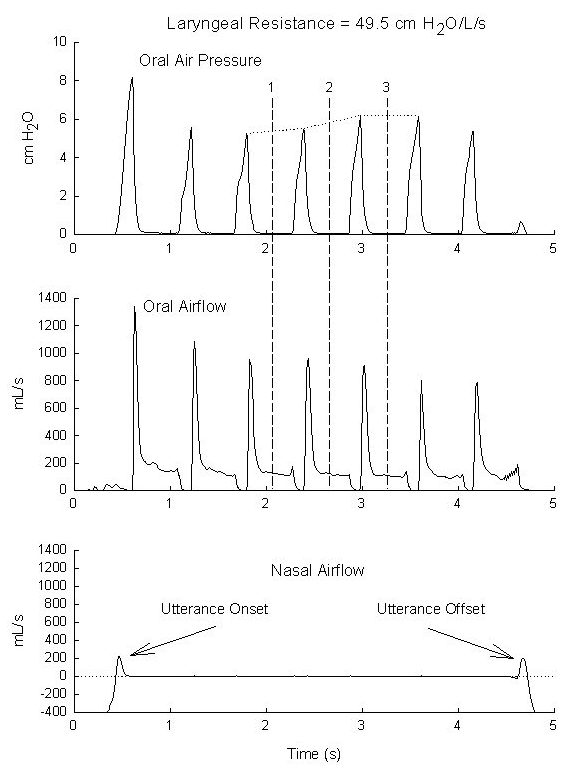
In the above example of a normal speaker, LAR was determined during the three vowel segments indicated by the vertical cursors. LAR was calculated as mean oral airflow divided by mean oral air pressure (interpolated between the pressure peaks). The lack of nasal airflow – except for utterance onset and offset effects – confirms that VP closure occurred, validating the use of oral air pressure. The calculated LAR value of approximately 49 cm of water per liter per second is within normal limits.
Selected References
Dotevall, D.R., Lohmander-Agerskov, A., Ejnell, H., & Bake, B. (2002). Perceptual evaluation of speech and velopharyngeal function in children with and without cleft palate and the relationship to nasal airflow patterns. Cleft Palate-Craniofacial Journal, 39: 409-424.
Lubker, J.F., & Moll, K.L. (1965). Simultaneous oral-nasal airflow measurements and cineflurorgraphic observations during speech production. Cleft Palate Journal, 2: 257-272.
Smitheran, R., & Hixon, T.J. (1981). A clinical method for estimating laryngeal airway resistance during vowel production. Journal of Speech and Hearing Disorders, 46:138-146.
Thompson, A.E., & Hixon, T.J. (1979). Nasal airflow during normal speech production. Cleft Palate Journal, 16:412-420.
Warren, D.W. (1997). Aerodynamic assessments and procedures to determine extent of velopharyngeal inadequacy. In: K.R. Bzoch (ed.), Communicative Disorders Related to Cleft Lip and Palate, Fourth Edition. Austin Texas: PRO-ED, Inc.
Warren, D.W., & DuBois, A. (1964). A pressure-flow technique for measuring velopharyngeal orifice area during continuous speech. Cleft Palate Journal, 1, 52-71.
Warren, D.W., Dalston, R.M., & Mayo, R. (1993). Hypernasality in the presence of “adequate” velopharyngeal closure. Cleft Palate Journal, 30:150-154.
Warren D.W., Dalston, R.M. Trier, W.C., & Holder, M.B. (1985). A Pressure-Flow technique for quantifying temporal patterns of palatopharyngeal closure. Cleft Palate Journal, 22, 11-19.
Yates, C.C., McWilliams, B.J., & Vallino, L.D. (1990). The pressure-flow method: Some fundamental concepts. Cleft Palate Journal, 27, 193-198.
Zajac, D. (2000). Pressure-flow characteristics of /m/ and /p/ production in speakers without cleft palate: Developmental findings. Cleft Palate-Craniofacial Journal, 37:468-477.
Zajac, D. (2005). Maximizing clinical acquisition and interpretation of aerodynamic and acoustic speech data in children with velopharyngeal dysfunction. In Perspectives, ASHA Special Interest Division 5 Newsletter, 15(2): 11-14.
Zajac, D.J., Powell, J., & Perotta, L. (2021). The palatal closure efficiency index: A new speaker-centered aerodynamic metric for the evaluation of velopharyngeal function during speech. Perspectives of the ASHA Special Interest Groups, 6(2), 368-374.
Zajac, D.J., & Yates, C.C. (1991). Accuracy of the pressure-flow method in estimating induced velopharyngeal orifice area: Effects of the flow coefficient. Journal of Speech and Hearing Research, 34, 1073-1078.
Zajac, D., & Hackett, A. (2002). Temporal characteristics of aerodynamic segments in the speech of children and adults. Cleft Palate-Craniofacial Journal, 39:432-438. 3
Zajac, D.J. & Mayo R. (1996). Aerodynamic and temporal aspects of velopharyngeal function in normal speakers. Journal of Speech and Hearing Research, 39, 1199-1207.